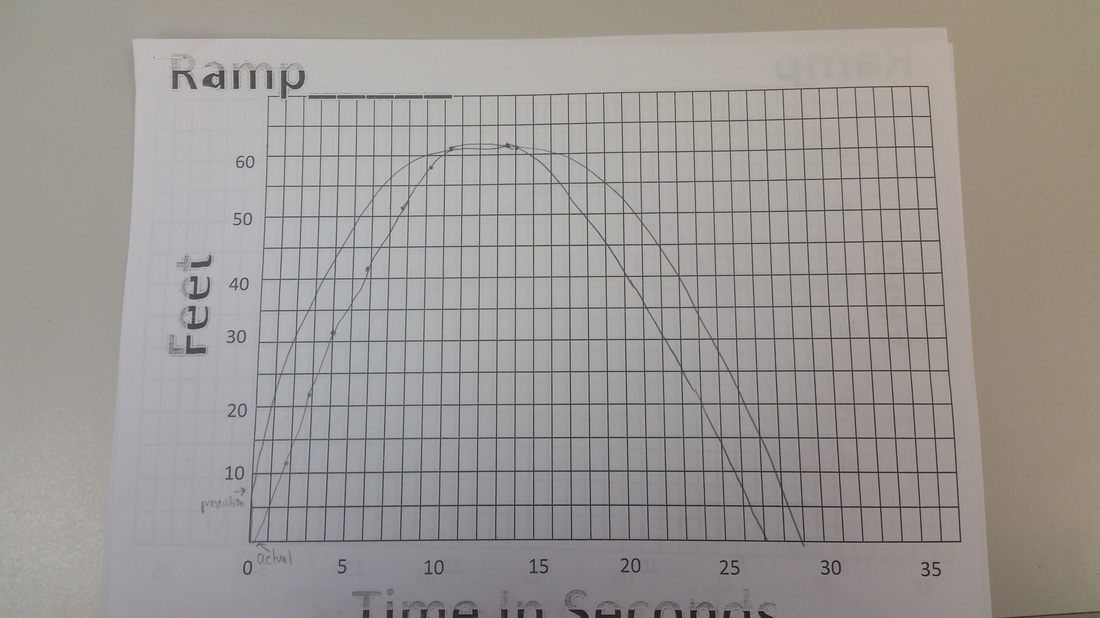
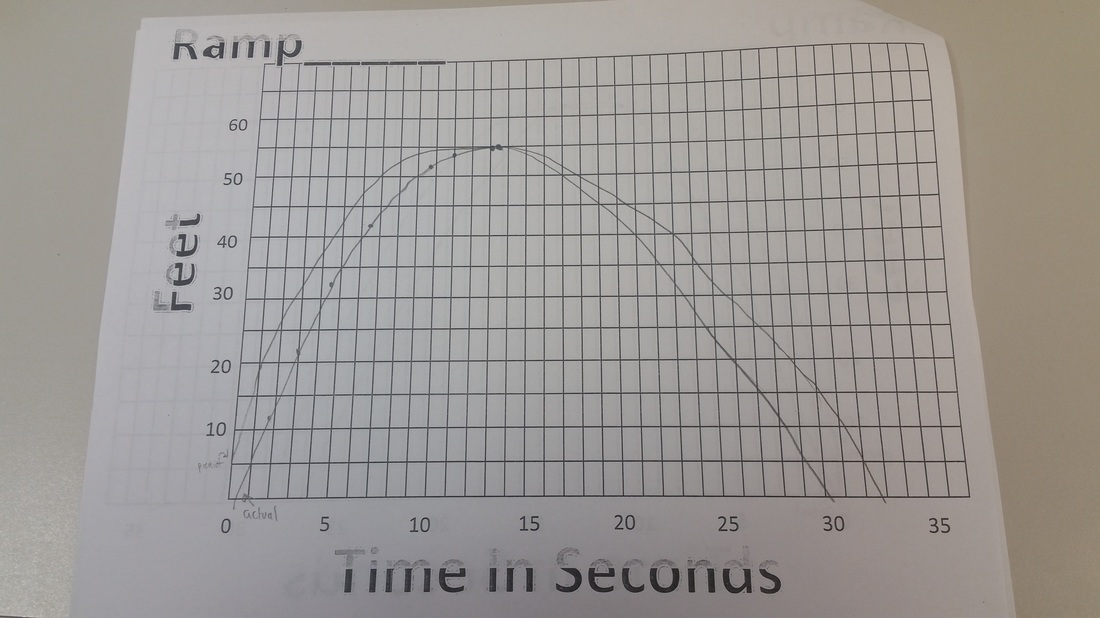
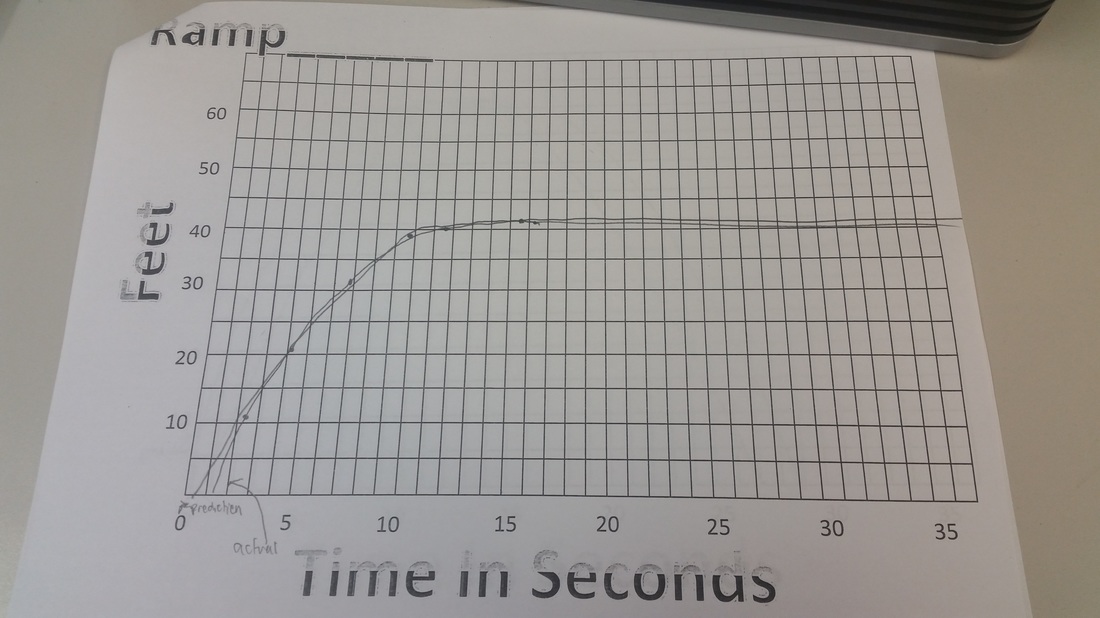
My Graphs on some of them were pretty close to one another because you can guess what the ramps are going to do because of how fast the skateboard was moving off the ramp. The reason they were different is because one graph is just a prediction and on is with an actual points from the video.Where the skateboard begins on the ramps and stops going back down are where the zeros are on the graphs.The three graphs all start at the same point but not at the same height. Two of the three graphs have relative ending zeros but for the third one we do not know if it ever ends. The three graphs have similar starting paths but not ending paths.The graphs rise the fastest at the start when it goes off the ramp and it falls the fastest when it starts going backwards .
 |  |  |
 RSS Feed
